


Isolation forest
Isolation forest is an unsupervised learning algorithm for anomaly detection that works on the principle of isolating anomalies,[1] instead of the most common techniques of profiling normal points.

In statistics, an anomaly (a.k.a. outlier) is an observation or event that deviates so much from other events to arouse suspicion it was generated by a different mean. Figure 1 gives a two-dimensional example of this distinction: the points labelled C1 and C2 sit in dense groups of normal observations, while O1 and O2 fall outside every group.
Anomalies in a big dataset may follow very complicated patterns, which are difficult to detect "by eye" in the great majority of cases. This is the reason why the field of anomaly detection is well suited for the application of machine learning techniques.
The most common techniques employed for anomaly detection are based on the construction of a profile of what is "normal": anomalies are reported as those instances in the dataset that do not conform to the normal profile. Isolation Forest uses a different approach: instead of trying to build a model of normal instances, it explicitly isolates anomalous points in the dataset. The main advantage of this approach is the possibility of exploiting sampling techniques to an extent that is not allowed to the profile-based methods, creating a very fast algorithm with a low memory demand.[1][2]
History
[edit]The Isolation Forest (iForest) algorithm was initially proposed by Liu et al. in 2008.[1] The authors took advantage of two quantitative properties of anomalous data points in a sample, that is:
- they are the minority consisting of fewer instances and
- they have attribute-values that are very different from those of normal instances
Since anomalies are typically few and very different from the other points in the sample, they must be easier to "isolate" compared to normal points. On the basis of this principle, Isolation Forest builds an ensemble of "Isolation Trees" (iTrees) for the data set and marks as anomalies the points that have short average path lengths on the iTrees.
Algorithm
[edit]
At the basis of the Isolation Forest algorithm there is the tendency of anomalous instances in a dataset to be easier to separate from the rest of the sample (isolate), compared to normal points. In order to isolate a data point the algorithm recursively generates partitions on the sample by randomly selecting an attribute and then randomly selecting a split value for the attribute, between the minimum and maximum values allowed for that attribute.

Figures 2 and 3 show this partitioning applied to a two-dimensional dataset of normally distributed points: Figure 2 isolates a point sitting deep in a region of normal data, and Figure 3 isolates a point that lies away from those regions. It is apparent from the pictures how anomalies require fewer random partitions to be isolated, compared to normal points.
From a mathematical point of view, recursive partitioning can be represented by a tree structure named Isolation Tree, while the number of partitions required to isolate a point can be interpreted as the length of the path, within the tree, to reach a terminating node starting from the root. A point lying outside the dense regions is separated from the rest of the sample by fewer splits than a point buried among similar neighbours, so its path to a terminating node is the shorter of the two (compare Figures 2 and 3).
More formally, let X = { x1,..., xn } be a set of d-dimensional points and X' ⊂ X a subset of X. An Isolation Tree (iTree) is defined as a data structure with the following properties:
- for each node T in the Tree, T is either an external-node with no child, or an internal-node with one "test" and exactly two daughter nodes (Tl, Tr)
- a test at node T consists of an attribute q and a split value p such that the test q < p determines the traversal of a data point to either Tl or Tr.
In order to build an iTree, the algorithm recursively divides X' by randomly selecting an attribute q and a split value p, until either (i) the node has only one instance or (ii) all data at the node have the same values.
When the iTree is fully grown, each point in X is isolated at one of the external nodes. Intuitively, the anomalous points are those (easier to isolate, hence) with the smaller path length in the tree, where the path length h(xi) of point is defined as the number of edges xi traverses from the root node to get to an external node.

A probabilistic explanation of iTree is provided in the iForest original paper.[1]
Properties of Isolation Forest
[edit]- Sub-sampling: since iForest does not need to isolate all of normal instances, it can frequently ignore the big majority of the training sample. As a consequence, iForest works very well when the sampling size is kept small, a property that is in contrast with the great majority of existing methods, where large sampling size is usually desirable.[1]
- Swamping: when normal instances are too close to anomalies, the number of partitions required to separate anomalies increases, a phenomenon known as swamping, which makes it more difficult for iForest to discriminate between anomalies and normal points. One of the main reasons for swamping is the presence of too many data for the purpose of anomaly detection, which implies one possible solution to the problem is sub-sampling. Since iForest respond very well to sub-sampling in terms of performance, the reduction of the number of points in the sample is also a good way to reduce the effect of swamping.[1]
- Masking: when the number of anomalies is high it is possible that some of those aggregate in a dense and large cluster, making it more difficult to separate the single anomalies and, in turn, to detect such points as anomalous. Similarly to swamping, this phenomenon (known as "masking") is also more likely when the number of points in the sample is big, and can be alleviated through sub-sampling.[1]
- High Dimensional Data: one of the main limitation to standard, distance-based methods is their inefficiency in dealing with high dimensional datasets:. The main reason for that is, in a high dimensional space every point is equally sparse, so using a distance-based measure of separation is pretty ineffective. Unfortunately, high-dimensional data also affects the detection performance of iForest, but the performance can be vastly improved by adding a features selection test like Kurtosis to reduce the dimensionality of the sample space.[1][2]
- Normal Instances Only: iForest performs well even if the training set does not contain any anomalous point,[2] the reason being that iForest describes data distributions in such a way that high values of the path length h(xi) correspond to the presence of data points. As a consequence, the presence of anomalies is pretty irrelevant to iForest's detection performance.
Anomaly Detection with Isolation Forest
[edit]Anomaly detection with Isolation Forest is a process composed of two main stages:[2]
- in the first stage, a training dataset is used to build iTrees as described in previous sections.
- in the second stage, each instance in test set is passed through the iTrees build in the previous stage, and a proper "anomaly score" is assigned to the instance using the algorithm described below
Once all the instances in the test set have been assigned an anomaly score, it is possible to mark as "anomaly" any point whose score is greater than a predefined threshold, which depends on the domain the analysis is being applied to.
Anomaly Score
[edit]The algorithm for computing the anomaly score of a data point is based on the observation that the structure of iTrees is equivalent to that of Binary Search Trees (BST): a termination to an external node of the iTree corresponds to an unsuccessful search in the BST.[2] As a consequence, the estimation of average h(x) for external node terminations is the same as that of the unsuccessful searches in BST, that is

where m is the testing data size, m is the size of the sample set and H is the harmonic number, which can be estimated by , where is the Euler-Mascheroni constant.


The value of c(m) above represents the average of h(x) given m, so we can use it to normalise h(x) and get an estimation of the anomaly score for a given instance x:
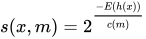
where E(h(x)) is the average value of h(x) from a collection of iTrees. It is interesting to note that for any given instance x:
- if s is close to 1 then x is very likely to be an anomaly
- if s is smaller than 0.5 then x is likely to be a normal value
- if for a given sample all instances are assigned an anomaly score of around 0.5, then it is safe to assume that the sample doesn't have any anomaly
Original Implementation
[edit]An implementation of isolation forest has been hosted on SourceForge since 21 July 2009 under the project name iforest, distributed under the GNU General Public License v2. The project describes itself as detecting data anomalies using binary trees and cites the original ICDM 2008 conference paper as its reference; it is listed as being brought to you by feitonyliu, and its most recent update shown on the site is 7 July 2014[3].
Open source implementations
[edit]- Spark iForest - A distributed implementation in Scala and Python, which runs on Apache Spark. Written by Yang, Fangzhou.
- Isolation Forest - A Spark/Scala implementation, created by James Verbus from the LinkedIn Anti-Abuse AI team.
- Python implementation with examples in scikit-learn.
See also
[edit]- Anomaly detection – Approach in data analysis
- Deep isolation forest
- SciForest
References
[edit]- 1 2 3 4 5 6 7 8 Liu, Fei Tony; Ting, Kai Ming; Zhou, Zhi-Hua (December 2008). "Isolation Forest". 2008 Eighth IEEE International Conference on Data Mining. pp. 413–422. Bibcode:2008icdm.conf...58L. doi:10.1109/ICDM.2008.17. ISBN 978-0-7695-3502-9.
- 1 2 3 4 5 Liu, Fei Tony; Ting, Kai Ming; Zhou, Zhi-Hua (March 2012). "Isolation-Based Anomaly Detection". ACM Transactions on Knowledge Discovery from Data. 6 (1): 1–39. doi:10.1145/2133360.2133363.
- ↑ "Isolation Forest". SourceForge. Retrieved 30 October 2026.
